EN
PHPRAY / EXPLORE

Start with the evidence.

Explore the product. Inspect the data. Choose your scope.

APACHE-2.0Local core, no accountCloud optional
Go to installation
ALWAYS-ON PHP OBSERVABILITYOPEN SOURCE

Every request.
A clear answer.

Duration, CPU, memory, SQL, HTTP calls, files and Redis, errors and N+1 patterns — in the context of a PHP request. See which plugin, query or external service is slowing a site down — one site, or all forty you look after.

Always-on captures summaries of eligible requests. Sampled profiling breaks down time by plugin and component.

Start locally
Start locallyLinux · root
curl -fsSL https://phpray.dev/install.sh -o phpray-install.sh
100% request summaries1 site or 100 — one listShared hosting · VPS · DockerLocal data. Optional Cloud.
Look inside a request
PHPRAY / CONSOLE

One request.
The full context.

Open a request from the WooCommerce test store. Follow PHP, SQL and HTTP time, then inspect the components.

PHPRay Console / store.example.com
DEMONSTRATION DATA
Your site

Every request tells a story.

LAST 24 H
42records
842ms
27queries
9detected
PHP 8.3 · WooCommerce · 3% profiling sampleSelect a request to inspect its trace ↗
Fits
your stack
PHP 8.0–8.5WordPressWooCommerceLaravelMariaDB / MySQLLiteSpeed
DOCUMENTATIONComplete docs. Transparent comparison. Your decision.Compare products
02 / What it looks like

The real console,
a real store.

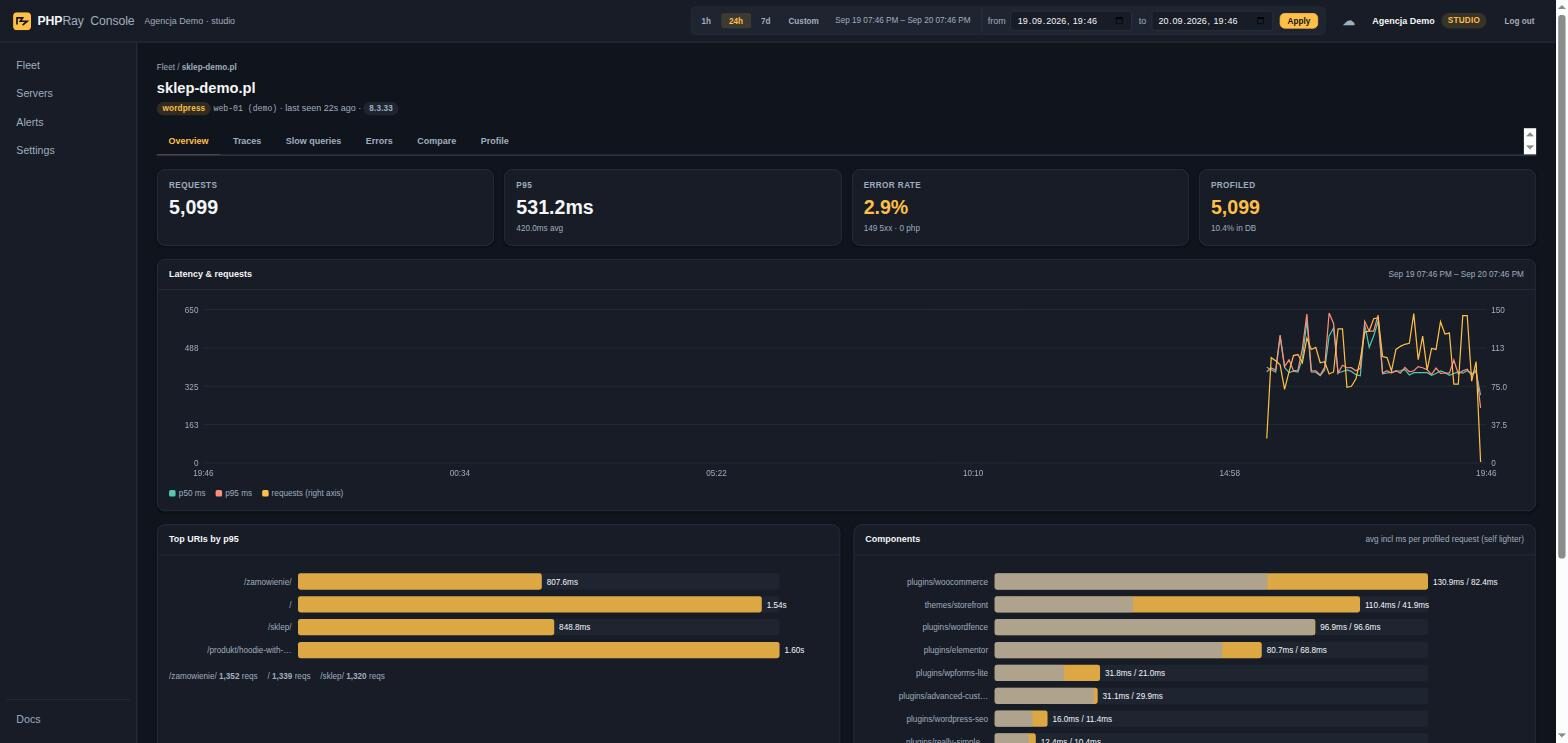
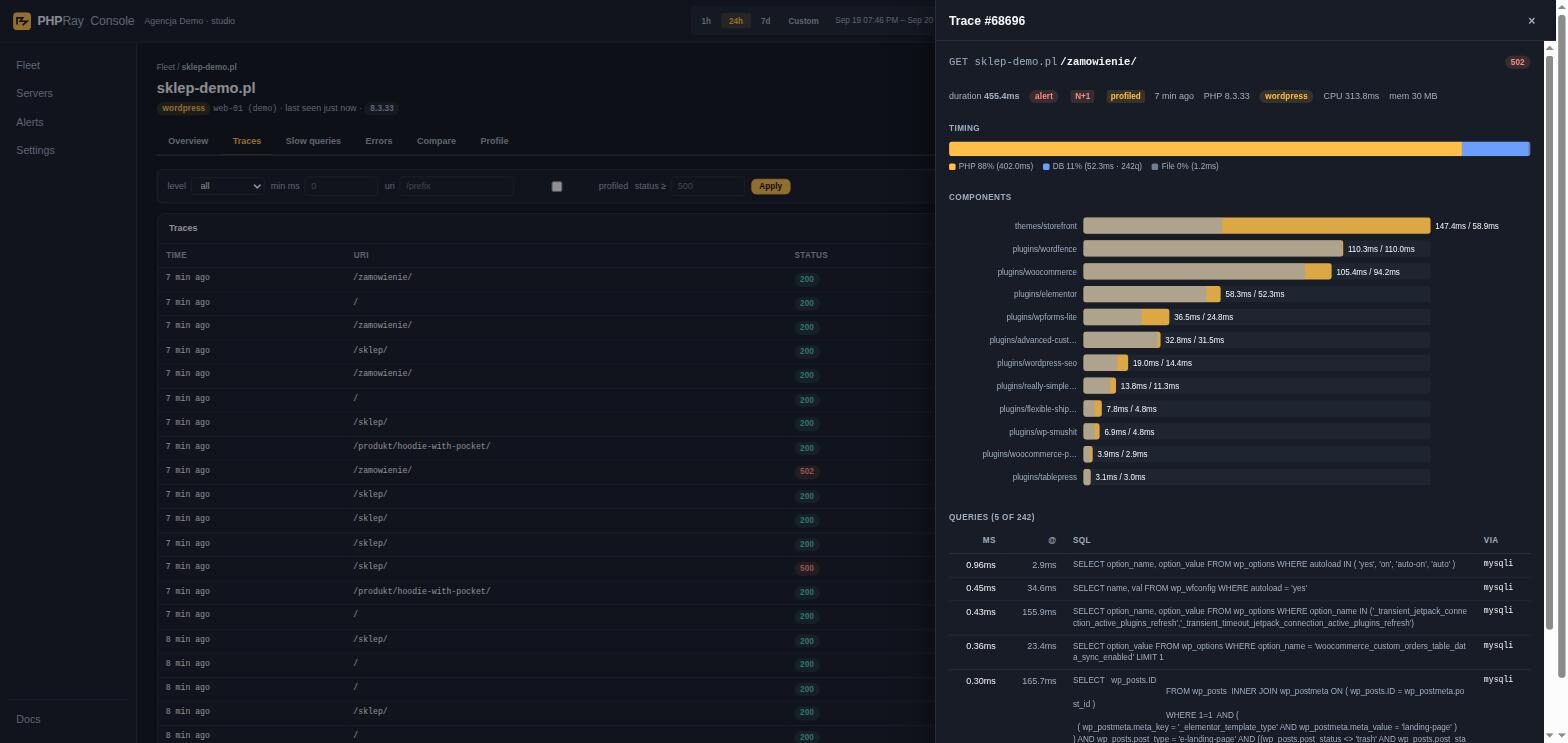
Screenshots from the public demo: a WooCommerce store with Storefront and 22 plugins, data from the last 24 hours. You can click through the same thing yourself.

PHPRay console: site overview with the latency chart, slowest URLs and per-plugin time
Site overview — p95, error rate, the latency chart, slowest URLs and per-plugin time side by side.
PHPRay console: request detail with the timing breakdown, components and SQL queries
A single request — a 502 on /zamowienie/: 88% of the time in PHP, 242 queries, an N+1 pattern and the plugin that costs the most.
Install it yourself
01 / From symptom to cause

Beyond “it is slow”.
Understand exactly why.

Connect PHP execution time, database queries and external APIs in a single investigation. No jumping between logs and plugin lists.

Catch the request that only happens once.

Duration, CPU, memory, SQL, outbound HTTP, files, Redis and PHP errors. The always-on layer records every request, including the one that is hard to reproduce.

request POST /checkout/   842 ms
├─ php      416 ms   49.4%
├─ mysql    318 ms   27 queries · N+1
└─ http     108 ms   api.shipping.example

A plugin, a theme
or WordPress itself?

Sampled profiling attributes execution time to components. Start with the most expensive component instead of disabling plugins one by one.

WooCommerce34%
Storefront29%
Wordfence24%
Other13%

Example from the WooCommerce test store: Storefront and 22 plugins. Values describe the profiled sample.

Spot repeated SQL.

Find slow fingerprints, query counts and N+1 patterns. Customer-specific parameter values do not need to appear in the report.

Waiting on an external API?

Separate time spent executing your code from time spent waiting on payment, shipping and other HTTP services.

From shared hosting to an entire fleet.

The extension runs inside PHP. A local collector stores request records in SQLite. Choose Cloud when you need to manage multiple sites.

Cloud is optional.

Open source. A local dashboard. No account required for local use. Data leaves the server only when you enable Cloud.

100%

of requests in the always-on layer

3%

default profiling sample

0 $

local collector and dashboard

1 view

PHP, SQL, HTTP and components

02 / A clear path to your data

Close to the code.
Far from guesswork.

Explore the architecture
[ 01 ] CONNECT

Choose your environment.

Use the PHP extension on your server, or the WordPress collector when loading a custom .so module is not an option.

[ 02 ] OBSERVE

Open your local dashboard.

Requests reach the collector through shared memory or JSONL. SQLite storage, an API and the diagnostics dashboard are available locally.

[ 03 ] RESOLVE

Investigate a specific problem.

Follow a slow URL to its SQL queries and components. After a change, compare the results with Studio or a higher plan.

YOUR SERVER / LOCAL BOUNDARY
PHP processRINIT / RSHUTDOWN · mysqli / PDO · cURL

phpray.so captures request, SQL, HTTP, file and error events. Observer API powers a separate, sampled profiling layer.

request record
RING BUFFER · /dev/shm/phprayand/orJSONL · /var/lib/phpray/traces
phpray-collectorGo binary · systemd

Reads the stream, stores SQLite data, applies retention and local alerts. Defaults: 30 days of history and a 4 GB database cap.

SQLiteTraces · SQL · 1-minute aggregates

Persistent local history. Retention windows and size limits are independent; the oldest records are pruned when either limit is reached.

REST API/api/v1/*

Local collector interface for the dashboard and CLI. It is distinct from the Cloud /v1/aggregates and /v1/traces protocol.

Local dashboard127.0.0.1:9191 · JWT

Sites, traces and component views. Loopback by default, with JWT access control. The local core needs no Cloud account.

PHPRay CloudOPTIONAL

Disconnected by default. Data stays local until you configure the connection.

Architecture diagram — the switch does not change server configuration.

Expand any node to inspect its scope. Full data protocol →

A clear view of overhead. The always-on layer records request-level events. Detailed function profiling is sampled. The WooCommerce store test results are preliminary, not a certified benchmark.
03 / Fewer tabs. More control.

One client or a hundred.
The same clarity.

Do not start every investigation from scratch. Keep stores, applications and environments in one console for the team that maintains them.

  • Fleet view: every site in one console — requests, p95, errors, DB share
  • Before-and-after deployment comparison from Studio
  • White-label reports and API — planned (Agency)
PHPRay use cases

Your fleet, in one place.

DEMO
Wstore.example.comWordPress · Production842 ms
Lapi.example.comPHP / Laravel · Production126 ms
Sstaging.example.comWordPress · Staging284 ms
Start with /checkout/. In this example, the database accounts for 318 ms of request time.
Trust starts with the architecture

Know what you collect.
Know who built it.

Review data handling
01 / LOCAL FIRST

Your server.
Your decision.

Data stays local until you enable Cloud. The extension and collector are open source (Apache-2.0). The local core needs no account or vendor telemetry.

Inspect the data flow
02 / DATA MINIMISATION

Fingerprints, not SQL values.

Cloud receives aggregates and selected traces. Query parameter values and SQL literals are replaced with “?” (fingerprints); no request bodies, cookies or visitor IPs. Error messages are truncated, which does not fully anonymise their contents.

Inspect the exact rules →
03 / EU CLOUD

Opole, Poland.

Cloud location: the European Union. Local-first remains available regardless of plan. Review retention, host controls and private-beta status before connecting production.

Retention and plan limits →
04 / PEOPLE & DEPLOYMENT

IQgroup → PHPRay

PHPRay is built by IQgroup Adam Buhl from Opole, Poland, the company behind the IQhost hosting brand with 5,000 PHP sites. We roll it out on our own servers first. The public description and documentation let you check the assumptions; they do not replace an independent benchmark.

5,000 PHP SITES
OVERHEAD / THE FULL PICTURE

Two layers.
Two different costs.

Always-on observes request events. Function profiling goes deeper and is sampled by default.

100%summaries of eligible requests
3%default function-profile sample

The remaining 97% collect no function samples. Detailed traces and Cloud export have separate rules and quotas.

What was measured, and what remains unverified

Preliminary measurements used WooCommerce, Storefront, 22 plugins, PHP 8.3 and OPcache. Alternating runs with and without the extension, on a laptop. Always-on fell within measurement noise. Profiling every request cost measurably more, but far below a classic execute_ex hook.

This is not a certified benchmark or an overhead guarantee for your server. Full methodology and raw data from a dedicated host are planned before 1.0. Profiling a single URL or time window limits the diagnostic scope.

Source and measurement limitations →
04 / Grow at your own pace

Start locally.
Scale with Cloud.

The core remains free and open source. Cloud is priced for your fleet, rather than as a separate subscription for every site.

CLOUD · BUY NOWPrices in USD, excl. VAT
Billed monthly
LOCAL + CLOUD FREE

Free

Local core and a first site in Cloud.

$0 / mo.
Free local core
  • Extension, collector, CLI, plugins — no local limits
  • Cloud: 1 site, 10k traces per day
  • 7 days of Cloud history
  • Local dashboard + REST API
Install locally
CLOUD / MONTHLY

Solo

Your projects in one place.

$19 / mo. excl. VAT
Card, monthly invoice, cancel any time
  • 3 sites, any number of servers
  • 50k traces per day
  • 30 days of Cloud history
  • URL profiling from the console
CLOUD / MONTHLY

Agency

Results you can show clients.

$249 / mo. excl. VAT
Card, monthly invoice, cancel any time
  • 100 sites, any number of servers
  • 1m traces per day
  • 60 days of Cloud history
  • White-label reports and API — planned
CLOUD / MONTHLY

Fleet

Your entire infrastructure. One view.

$499 / mo. excl. VAT
Card, monthly invoice, cancel any time
  • Unlimited sites and servers
  • 5m traces per day
  • 90 days of Cloud history
  • Before / after compare and console profiling

Host Edition

FOR HOSTING PROVIDERS

Self-hosted console on your server + the DirectAdmin plugin (admin and user views): 2,500 USD per year for up to 10 servers, +200 USD per year for each additional one.

Prices in USD excluding tax, billed monthly by card through Stripe; tax is added according to the buyer's country. Cancel any time in the customer portal. The Free account needs no card.

05 / Questions worth asking

Before you connect
your first site.

Architecture, data coverage and getting started — without the fine print.

Do I need root access?

Installation depends on your environment. The extension runs inside PHP, but the ability to load a custom .so module depends on your hosting provider. If that is not available, use the WordPress option. The system installer using sudo requires administrator privileges.

Is every request fully profiled?

No. The always-on layer records every request: duration, CPU, memory, SQL, HTTP, files, Redis and errors. Detailed function and component profiling runs on a 3% sample by default. Request tracing and function profiling are separate measurements.

Does PHPRay work with WordPress and WooCommerce?

Yes. They are a primary use case for PHPRay. The component view attributes time in profiled requests to plugins and themes. The extension-free option uses WordPress APIs and does not provide the same instrumentation coverage as the PHP module.

Which PHP versions and platforms are supported?

Extension: PHP 8.0–8.5 NTS, glibc / musl, amd64 i arm64. Kolektor: amd64 i arm64 (binarka, .deb, .rpm). Dobierz plik do wersji PHP, ABI i systemu.

Is data sent to Cloud automatically?

No. The extension and collector run locally. Connecting to Cloud is a separate choice. The public demo at app.phpray.dev/demo is read-only.

Can I buy Cloud right away?

Yes. Create a Free account right away on the pricing page (the console token is shown immediately). Paid plans are bought there by card via Stripe, billed monthly, cancel any time; if the Buy button is not active, write to [email protected].

The next slow request?
You will know.

Explore the example. Inspect the details. Make a decision based on data.

Choose a plan