Xdebug cannot run in production.
This can.
You know the shape of it. Something is slow on production, you cannot
reproduce it locally, and the profiler you own is the one you are not allowed to turn on
there. So you sprinkle microtime(), read the slow query log, and guess.
PHPRay records every PHP request where the problem actually happens: wall time, CPU, memory, every SQL query as a fingerprint, every outbound HTTP call, errors and N+1 patterns. It is a C extension plus a single Go binary. No agent with root, no SaaS account required, and the core is Apache-2.0.
# one line, then look at what is happening right now
curl -fsSL https://phpray.dev/install.sh -o phpray-install.sh
less phpray-install.sh          # it asks for root; read it first
sudo bash phpray-install.sh && phpray top
See a real report → Console on live traffic
The report is a real result from a production shop with the site name stripped. Nothing to install, no account, no e-mail address.
Why the tools you have do not fit
| Tool | Where it stops |
|---|---|
| Xdebug profiler | Superb locally and for step debugging. In production the overhead is not acceptable and you get a cachegrind file per request, not a history you can search a day later. |
| New Relic, Blackfire, Tideways | Real products that solve this — if someone installs the agent and pays per host. On shared hosting you cannot install it at all, and on a small VPS the price is out of proportion to the app. |
| Slow query log | Tells you a query was slow. Not which request ran it, what else that request did, or which plugin or library issued it. |
microtime() in code | Works, and you have to guess the right place first — which is the thing you are trying to find out. |
What you get instead
Every request, not a sample
Sampling agents keep statistics between samples. PHPRay writes one record per request, so the checkout that failed at 03:00 is still there at 09:00 — with its queries, its outbound calls and the error that ended it.
No root, no agent
If you can edit your own php.ini — and on most shared hosting, cPanel,
Plesk and CloudLinux you can — you can load it yourself. Nothing leaves the PHP process
unless you configure it to.
Overhead measured, not promised
On a WordPress page rendering in 48 ms the request-recording layer could not be separated from the baseline across five interleaved rounds. The per-plugin breakdown costs about 4% — and the same at any sample rate, because the observer is either installed or it is not.
What the answer looks like
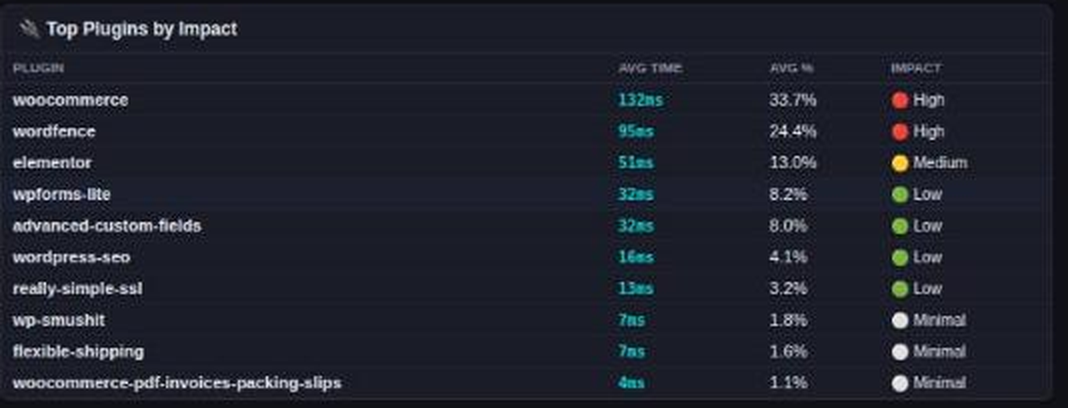
From a real WooCommerce store, 39,995 requests over one week — the whole finding, not a teaser:
- urgent Requests are failing. 1,089 responses with a 5xx status, with the failing paths listed — each one a visitor who saw an error instead of a cart.
- worth a look The queries that cost the most.
The
wp_optionsautoload query — 3.6 s in total over the window. Not the slowest per call, the most expensive overall, because it runs on every request. - for reference Where the time goes, component by component. wordfence 97 ms per request, woocommerce 82 ms, elementor 81 ms, the theme 42 ms.
SQL is stored as fingerprints with the literals stripped —
WHERE email = ?. Request bodies, cookies and sessions are never touched.
Where it stops — so you do not find out later
- It is not a line-level profiler. You get per-component attribution, not a flame graph of every function call. For that, Xdebug locally is still the right tool.
- No step debugging. Different job.
- The WordPress plugin (pure PHP, no extension) sees less than the extension: not the time before WordPress boots, and not requests that die before shutdown.
- Cloud is optional. The local collector, the dashboard and
phpray topare free and unlimited; you only pay if you want several servers in one console with longer history.
Look at your own traffic
Install locally in one line — open source, Apache-2.0, no account. Or take a free cloud account: one site, 10,000 traces a day, 7 days of history, no card.
Install it locally Create a free accountWordPress, and no shell at all?
The plugin does the same job in pure PHP 7.4+, GPLv2 — no extension, no daemon, no server access. Upload it under Plugins → Add New → Upload Plugin, paste the server key from the console, and the data flows.
Download the WordPress plugin (0.1.3, 34 kB)Differences from the extension are in the documentation.